
I am a die-hard NFL and college football fan. When I am in Europe, I get up at 1.45am on Friday mornings to watch Thursday Night Football. For the last decade, I have watched days 1 and 2 of every NFL draft live.
And last month, in the midst of COVID-19, the world saw the first ever virtual NFL draft. What a logistical masterpiece it was.
I admit, creating a segway from the NFL draft to construction CO2 emissions feels like a stretch. But hear me out.
One thing I appreciate every year during the draft is the extraordinary accomplishment it is for these young players to make the cut into the NFL. Just 0.16% of every graduating class of high school players makes it into the NFL. Think about this: the decisions they need to take to get into the NFL have not happened this year. Nor last year. They happened 15-20 years before, when they were aged 4–5, adopting a training and diet regimen that would prepare them for the NFL.
Let’s transfer that into construction emissions. The discussions we observe are centered around having to replace bad construction materials to solve emissions.
The problem with that is: all decisions related to which materials and how much of those materials get used are not taken during construction. The materials decisions are taken months or even years earlier during the architecture and engineering phases. In spite of that, many folks still discuss CO2 in relation to materials during the construction phase. Herd instinct, I guess.
Or to put it in a visual that gamers from the 1980s will appreciate:
So against the grain, we asked ourselves: can we prove that the issue is not the materials themselves, but the decision and selection of materials during pre-construction? Let’s see here.
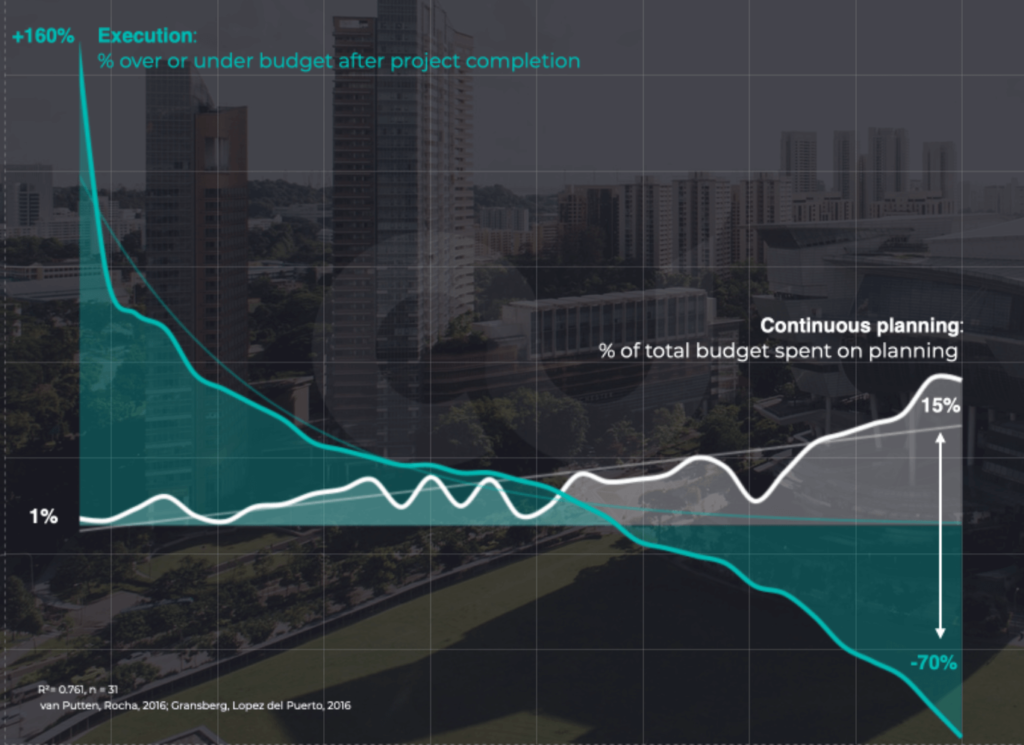
1/ So how bad is it, really? For most questions in life, the answer depends on who you ask. For this question, it does not. Uniformly, numbers suggest that less than 30% of all projects over the past 3 years have come within +- 10% of the budget. In other words: 70% of projects are at least more than 10% inaccurate. Studies show regular inaccuracies up to +160%. Everybody has a favorite screwed up project in their hometown. Talking about bad planning, huh.
2/ We found a mind-blowing correlation between cost overruns and the effort invested in pre-construction planning. We have meta-analyzed various recent studies on the subject. What emerged was the following picture — on the horizontal we mapped the projects, on the vertical we mapped the cost over- and underruns (yes, underruns also occur from time to time…).. Check it out …
3/ Now, the impact of bad planning on cost is intuitive. What about the impact of bad planning on CO2 emissions, though? Studies show that during pre-construction on average 140–380 design conflicts and omissions are made. If you avoid a portion of those planning errors just by applying BIM, studies find that huge improvements can occur. Eg. 96% of concrete waste can be avoided (96%… blows my mind). And: We found various reputed studies on how much CO2 can be avoided by more efficient engineering — the lower end numbers were 2.5+ kg of cement per m2 floor area built, 6.7+ kg of steel and another 6.5+kg of other mined materials (copper, bauxite).
4/ Ergo: If you build a new Taipei 101 with 412’500 m2 of floor area, you could save 31+ million kg of CO2 just through better pre-construction planning on that one building. That is the equivalent of 6’700 brand-new passenger vehicles driving 10’000 miles per year.
5/ Fine, so now we know that on a single project, there is some lever. But what about the global scale? Construction and the extraction of construction materials account for 17% of global CO2 emissions. 51% of the global industrial carbon emissions come from the processing of four key materials: steel (25%), cement (19%), plastic and aluminium (3%). Construction accounts for more than 50% of world steel demand (if you’re like me, you might have thought automotive was the largest consumer — uh-uh). This all happens before construction has actually begun. Collectively, concrete, steel and bricks generate 315 MT of waste per year globally. Our point here: huge lever on optimizing your architectural material mix before you even begin construction on a global scale.
6/ Now, the good news is: we are seeing innovative building materials taking encouraging steps more recently. We are seeing founders building around new, more sustainable materials, eg. waste polymer materials and cross-laminated bamboo. But: the supply of these more sustainable materials is just not yet large enough to cover the massive construction demand. In the US for instance, 90% of the timber harvested already comes from one third of the timberland base. In other words: if we increase our timber demand exponentially to use in construction, we’ll have no forests left. Not a great scenario.
7/ And: concrete is just a massively easy-to-deploy structural material to bear static loads. While we see encouraging steps where sustainable materials are being increasingly used for renovation and residential building projects, projects which require complex structural loads — such as public infrastructure — will require more pre-construction innovation for us to reduce CO2. Example: in India, residential buildings — which tend to have low structural requirements — currently account for only 20% of total construction project value. Which means: the other 80% is made up from demand with high static load requirements (infrastructure, mid-rise, high-rise, etc).
8/ So that means: if we want to get CO2 emissions under control, we need to become able to handle high static loads with lower amounts of alternative materials. That is the fundamental crux of the issue. Many of the architects and engineers we speak to see auto-generative design (AGD) not primarily as an automation tool — they see AGD as a simulation tool to engineer high static load structures to reduce the amount of eg. concrete needed, and to reduce the amount of omissions and errors to reduce waste. We agree.
9/ That’s great. But not the full picture just yet. The old adage is: you cannot control what you don’t measure. The same is true for optimizing CO2 during pre-construction. We observe a lack of transparent benchmarks to compare a project’s CO2 emissions against. This is especially important since the CO2 footprint is a result of highly interdependent engineering and planning during pre-construction. How will my CO2 footprint be impacted if I redesign this floor? How will it impact my material choice? And even more complex, how will it impact my emissions from logistics? Benchmarks are the final missing piece to complement AGD + BIM + alternative materials.
10/ As investors, we doubt that associations or government bodies will move fast enough to provide the benchmarks — we are excited about founders tackling the benchmark issue from
(1) the interop/API angle and
(2) highly advanced multi-parameter optimization and simulated design during the architecture and engineering stages.
To paraphrase an old piece of VC wisdom on this issue:
‘Come for the interoperability, stay for the transparency’
So, to summarize:
In our mind: the issue is not the materials themselves, but the decision and selection of materials during pre-construction.
To all founders attacking CO2 during the architecture and engineering phases of construction: let’s go. We’ve got it.
Credits go to my colleague Seb for the massive contribution to this article (I did the NFL prose, Seb did the hard work) and the data wizards in our Foundamental Insights group.
Sources:

The benefits of being a global investor is that we see trends and themes across markets but also become market insiders of what differentiates these markets from each other.
You might be thinking, “Yeah, so what?”. Let’s put it this way,
“To know that we know what we know, and to know that we do not know what we do not know, that is true knowledge.”
— Nicolas Copernicus
For the purpose of this article, let’s take CO2 in construction within European markets as an example to show how a global view helps.
Addressing the CO2 in construction problem will be different in Europe than in other regions. Tackling this challenge is not a “one size fits all” approach. The approach in Europe will and should be different than in North America or Asia.
So let’s get started — so you “know” ?
1/ Germany and most of Europe have a long-standing tradition of building “brick by brick”. When we compare the average residential lifetime of buildings across the 3 major regions — North America, Europe, and Asia — we find stark differences. In China, the average lifetime of urban residential buildings is 34 years (with the average being greatly impacted by massive new construction over the past 20 years), in North America it is approximately 61 years, and in Europe it is a whopping 120 years due to the solid brick building method.
2/ And: the majority of the building stock in Europe was built post-WWII, as noted below. Meaning, a large percentage of the building stock has several decades of lifetime ahead.
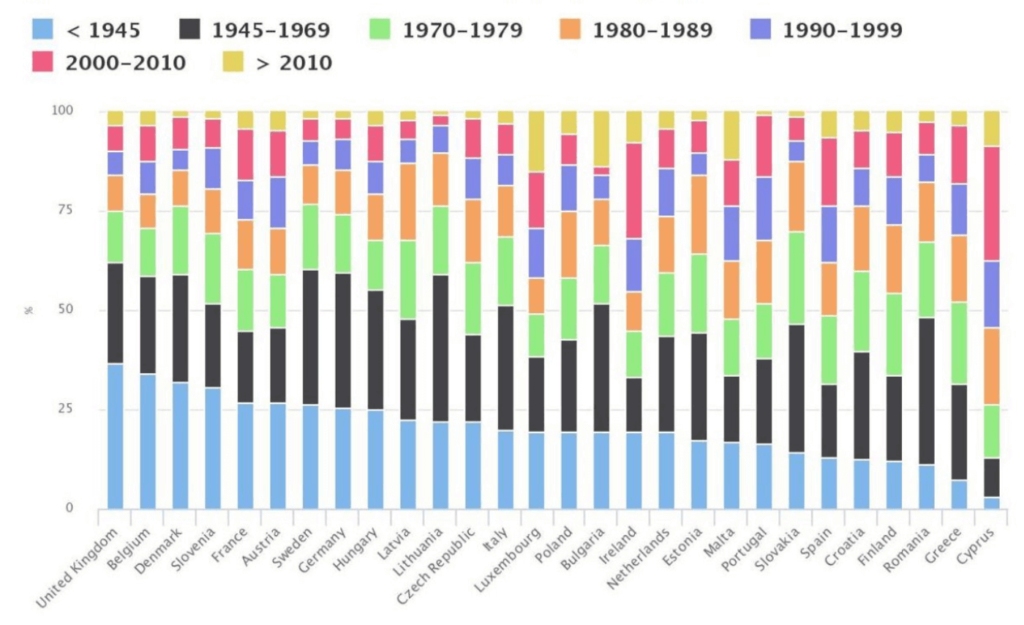
3/ Ergo: We have to consider the lifetime value of the building stock to really determine how to best address the carbon emissions of buildings. The remedy is different for 30 years vs. 120 years.
What unique challenges does this 100 year old factor present, then?
4/ There is no easy solution to refurbish the existing housing stock to high energy efficiency standards. This is compounded by the skilled labor shortage, increasing demand, and Europe being the de facto leader in some circles to lead climate-related changes.
5/ And: This is highlighted in the fact that the German government is raising government subsidies to support refurbishment efforts up to 40% of capital invested (via grants, implicit value of loan, or other external financial support). Simply exchanging the heating unit isn’t going to drastically reduce emissions to meet targets.
6/ And: Of the 41% of CO2 emissions coming from the construction and built environment sector, 26% of that is from the emissions post-construction over the lifetime of the building. Considering the lifetime differences between the three regions, this means that the average building in Europe is emitting these excessive emissions post-construction for 4x longer than in Asia and 2x longer than in North America.
7/ Ergo: Europe, we have a problem. There will not be the same level of new build at higher efficiency standards as there will be in Asia and North America, so the need to find an effective way to refurbish the existing housing stock is more important now than ever before.
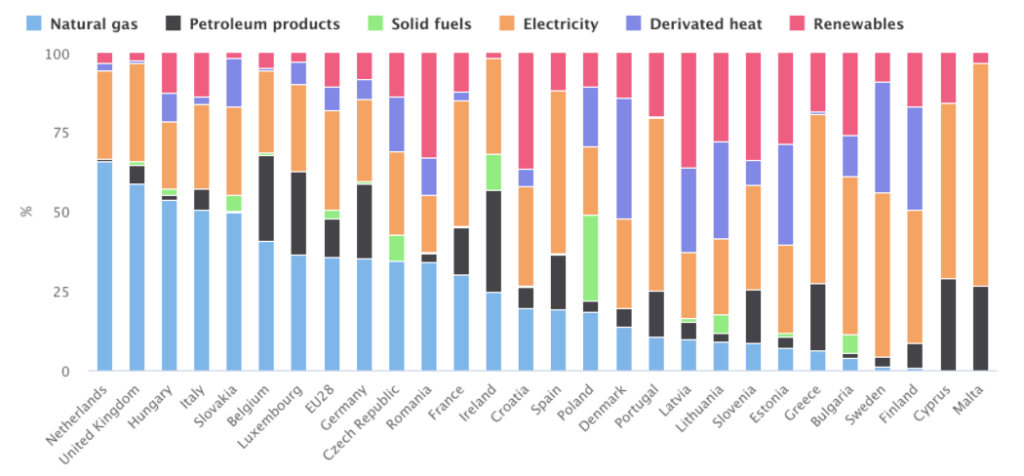
8/ And: A large number of European countries still use a substantial percentage of natural gas and petroleum products for energy consumption, so the carbon problem isn’t going away imminently.
Not all hope is lost, right?
9/ There is hope and more attention focused on net zero buildings — buildings where the amount of energy consumed by the building is equal to the amount of renewable energy produced by the building on site. The operation of the building, therefore, does not generate greenhouse gases.
10/ Ergo: While the residential building stock isn’t going away anytime soon, the spotlight on the need to ramp up refurbishment in a cost-efficient way has just started to shine brighter. There is opportunity for first movers (i.e. our portfolio company Q-Bot) to grab market share and take advantage of the large subsidies that aren’t going away any time soon.
Europe could adopt the North American or Asian approach and shorten the lifetime of its building stock. In this, there would need to be a strong mandate to build with green materials for new builds (and recycle the materials of the old, demolished building stock). The more realistic option, rather than large-scale demolition of existing stock with decades of life remaining, is to identify, implement, and scale a solution that fits the needs of this specific region. The market is large enough to build that/those “unicorn/s” that we all hope for in the VC industry. Let’s see what happens….
Thank you (!) to the Foundamental Insights team for uncovering unique nuggets of information for this article.
References:

On the route to a carbon neutral world, construction can’t be bypassed.
Knowing that, we have to go down the rabbit hole to find the drivers of CO2 emissions and identify ways to avoid these emissions. Spoiler alert: it’s not as easy as plugging out conventionally generated electricity and plugging in renewables.
1/ Yonsei University conducted a study in which they measured CO2 emissions during the construction phase of a building. According to their research, 2.4% of CO2 resulted from material transportation while 4.2% of CO2 was produced during on-site construction. However, the majority of emissions — 93.4% — was coming from the production of building materials used to build.
2/ Ergo: Optimizing supply chains and operations on-site is advisable from an economic point of view. But: it doesn’t move the needle on emissions. The main lever to reduce emissions in the construction industry are building materials.
3/ And: Within the subset of building materials, steel, cement, and other mineral materials have the largest impact, making up more than 50% of the CO2 emissions in the construction industry
The impact becomes even more tangible when looking at absolute numbers: the production of one ton of steel emits ~1.8 tons of CO2 while the production of one ton of cement releases ~0.58 tons of CO2. And: in 2018 ~4bn tonnes of cement and ~900mn tonnes of steel were used in the construction industry.
4/ And: There are 3 ways to cut down these emissions:
5/ Ergo: When assuming that we can’t scale down the use of cement and steel to zero, we have to find ways to decarbonize their production processes.
6/ And: Both production processes have similar key characteristics.
7/ And: These key characteristics make it particularly difficult to decarbonize the production processes.
8/ Ergo: Decarbonizing the production of building materials is highly challenging but technically achievable through a combination of different solutions.
9/ But: the most promising solutions (such as CCS or the use of hydrogen) are currently in pilot stage and not available at industrial scale.
10/ Ergo: Turning today’s building materials carbon neutral isn’t a plug & play game. It’s a complex challenge that forces us to think of more than just a carbon neutral version of what we do today. We have to rethink use-case specific choices of building materials and ways to use materials more efficiently than we currently do.
The good part of this is that we already have one or two ideas on how we can make it work. → stay tuned for Foundamental’s next article.
Sources:
First of all, to our loyal subscribers: apologies for the clickbait title. I wish I could say it did not happen on purpose — but yeah, it totally did. In dis/constructed articles, we slice facts and logic into 10 pieces. So, you know, I asked myself: “why not slice ten big coronavirus facts around construction”. The thing is: right now, facts alone don’t seem to sell — folks seem to love a good panicky title. Well, here you go.
With that out of the way: let’s move on to business. What is Covid-19 doing to the AEC sector? When panic and pandemic are used interchangeably — it’s time for facts and logic.
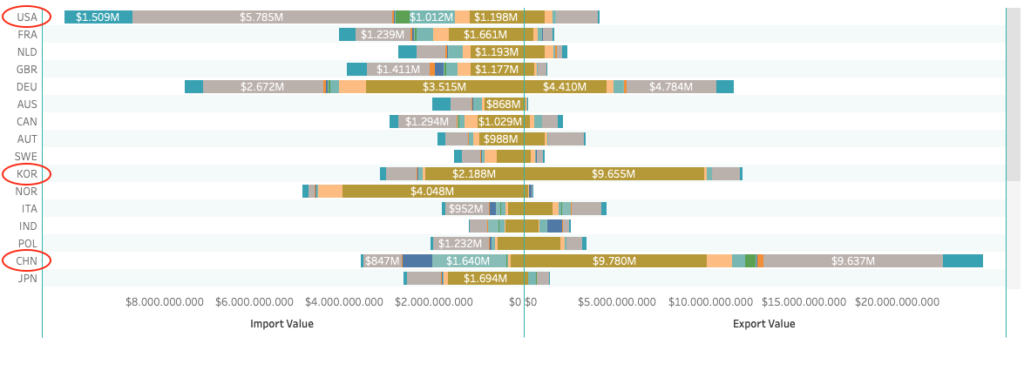
As current events unfold in real-time, getting data on construction and building materials in equal real-time can be challenging. For example: the EU released their trade figures for January 2020 on March 9th, 2020. → 37 days of delay. That doesn’t help much right now.
Better: there are economies whose data we can use as leading indicators (eg. China) for what we should expect to happen to the construction sector in economies lagging behind in the Covid-19 outbreak (eg. United States).
1. What’s true: Western economies are reliant on building material imports from China and Korea. The US imports 10x more building materials than they export. Some American construction firms rely on China for up to 80% of their materials.
2. But: In January 2020 — like they tend every year around Chinese New Year — Western economies stockpiled building materials such as steel from China.
3. And: Major Chinese container ports saw a 9% increase in bulk shipment volumes last week (week of March 3rd). Production facilities begin to ramp up back to normal.
4. It is true: Construction projects on Chinese territory came to a full temporary halt in due to workers delays. 130’000 construction workers in Hong Kong alone had been temporarily laid off or hours cut. And: after lifting the Chinese quarantine measures, construction projects dealt with ramp-up issues as many workers in China were unable to get to their sites in the first hours and days. But: China is recently ramping up its transportation systems. This is increasing the rate at which construction workers get back on site.
5. Meanwhile, in the US: OSHA considers the risk of transmission on construction sites very low. That notwithstanding: anxiety among construction professionals abounds.

6. As evidenced by China, disruptions do not come so much from construction workers being sick — but if they can get to site. We must monitor public quarantine measures and corporate responses (eg. stay-home policies). As of today (March 16), we cannot see a major disruption of construction workforce in the US.
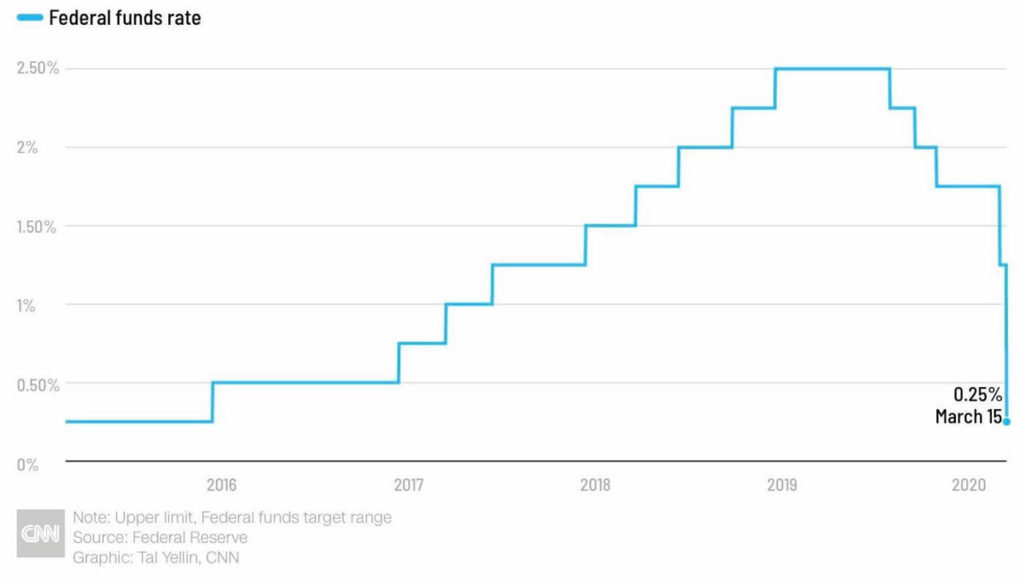
7. In response to Covid-19: the Fed has already lowered rates for the past few weeks, culminating in an effective 0% rate as of March 15. These actions led to high demand in refinancing mortgages from borrowers in past days.
8. The big question weighing on our mind is: “What will lenders in lagging Covid-19 economies do?” Lenders fear construction projects get (a) delayed, leading to bad debt, and (b) force majeure claims and lawsuits with their borrowers to resolve any incurred bad debt. The main point to observe here is how long construction activity comes to a halt due to (1) supply chain disruptions and lack of material and (2) disruptions in worker availability. If construction disruptions continue for several weeks, lenders will likely explore moratoriums for new lending on big construction projects . On the other hand: if construction halts are temporary phenomena — like seen in leading indicators like mainland China and Hong Kong — we should expect construction activity not to produce a ton of bad debt, and lenders retain trust. Our view is backed by lending experts at Fidelity.
9. China is the main leading economy in the Covid-19 outbreak. The Chinese National Bureau of Statistics reported a 20% YoY decrease in retail sales. But: this includes a devastating January, as the main lock-down measures in China had been put in place only January 23. Construction activity had resumed to 40% on February 25. We have no official construction statistic of the past 3 weeks yet — based on our conversations with folks on the ground in China we estimate that 80–90% of the construction activity is back to normal as of today. S&P Global expects Chinese construction activity back at normal growth as of Q2/2020.
10. We have not yet seen reports of major price variations in building materials in lagging economies such as the US.
Recession kicks in when money stops flowing. And money stops flowing when trust in commercial partners is hurt. When we look at the data, we find no pattern that indicates a fundamental erosion in the trust commercial partners place in each other in the global economies as a result of Covid-19.
The current situation is different than the subprime crisis in 2008/2009, where trust in the quality of mortgages and the ability of banks to sustain the bad debt had been significantly eroded. This created wide-spread ripple effects among market participants not trusting each others’ promises.
Covid-19 — other than subprime mortgages — has an inherent safety switch built in: people get healthy again. The fundamental promise is unshaken so far: “I will show up to work on a construction project”. Once people are cured, it is likely we can again trust their promise automatically.
To illustrate our point, compare the following charts:
In the 2008/2009 financial crisis, China’s QoQ growth decreased to 6%.

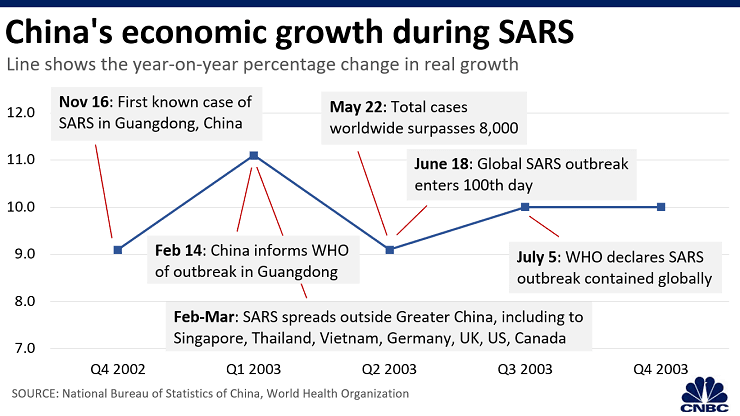
During the SARS virus crisis, China’s QoQ growth remained around 9%.
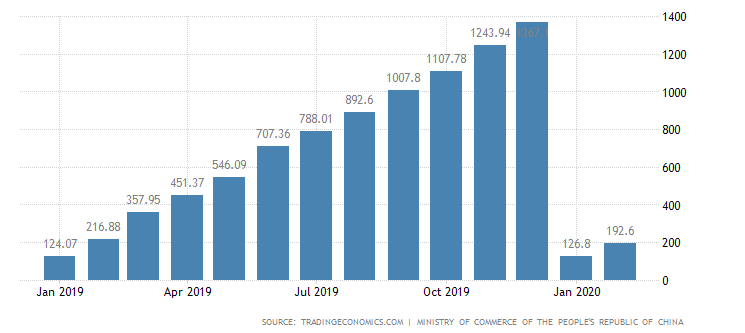
In March 2020: Foreign direct investment into China kept coming (though -8% YoY), even at the height of the Covid-19 outbreak.
And finally, fact is: outbreak centers so far have aligned along an east-west pattern of similar climate and nadir of temperature. Whether there is causality or just correlation, not even the world’s best virologists can say right now. Make of it what you want.

For me as an early-stage investor in ConstructionTech, all these facts mean one thing: I remain optimistic, but I also remain picky about which economy I invest in. I remain quite intrigued of the opportunities that right now get created in Asia, as Asian governments have shown dynamic and decisive responses to Covid-19 (China, India), or are in more economic and climatic environments that might just be more robust to Covid-19 (India).
Also, some of the world’s most valuable ventures were founded during 2007–2009. Part of the reason in B2B was that when competition got swept away, those left standing had an open playing field for a while. The current market environment is an opportunity for companies in Western markets to exploit truly global trends (eg. tech adoption for remote collaboration), build resilience, and be the #1 in an open playing field in AEC.
At Foundamental, we are monitoring what happens in India and a few other lagging economies in the next 10 days, and will use especially the Indian economy as a key indicator how to place our money in the coming weeks and months. History shows previous corona pandemics took roughly seven months to play out. We are currently in month 4.
The bottom line: We remain optimistic global investors.
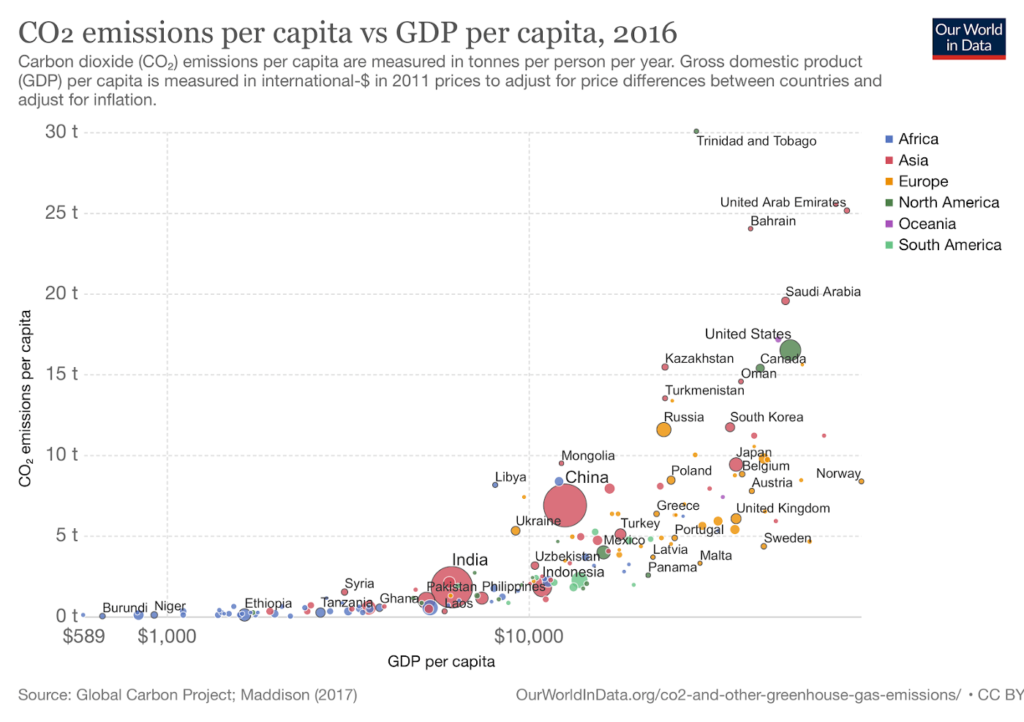
Stating the obvious: we have been living on credit for decades. Since 1960 the per capita CO2 emissions have been growing by 55%. The more prosperity we have been attaining, the more CO2 we have been emitting. An increase in GDP per capita is highly correlated with an increase in CO2 emissions per capita. The reasons are diverse: our individual mobility preferences and our food habits are just two examples.
And: not only have we seen a CO2 per capita increase but also a dramatic increase in the world’s population. The global population grew from 3bn in 1960 to today’s 7.5bn. And: until 2060 the world’s population is expected to keep growing to 10bn.
While the consequences of these developments have been abstract to many people in recent years, they are now becoming unpleasantly tangible. According to a YouGov study, 50%+ of people in 28 countries fear that climate change will severely harm economies, destroy cities and even start wars.
When looking for ways to achieve the targets set in the Paris Agreement, one sector is often overlooked: construction.Turning construction carbon-neutral is, however, mission-critical.
1/ Generally speaking, construction impacts our climate in two ways: Firstly, the construction process itself directly affects CO2 emissions. Secondly, the amount of CO2 emitted during the operations phase of the building is to a varying degree predetermined within the pre-construction phase.
2/ And: The impact is significant. The construction industry accounts for 13% of global CO2 emissions per year. For example through the building materials we choose to build with or the supply chains we organize to deliver construction projects.
3/ And: During the operations phase of buildings, another 28% of global CO2 emissions are emitted per year. Given that buildings’ lifespans may range from 40 years to even 100 years, poor design choices made in the pre-construction phase can have a lasting impact on the buildings’ CO2 footprint.
4/ Ergo: Construction matters disproportionately. Through its direct or indirect levers mentioned in 1/ construction affects 41% of the yearly global CO2 emissions.
5/ And: There is no end in sight. A lot of CO2 emissions are still to come. An increasing population and increasing prosperity are expected to drive 230bn m2 of new construction within the next 40 years.
6/ Ergo: If we want to satisfy the demand for construction in a sustainable way, we will have to change the way we engineer, design, and build our buildings and infrastructure as fast as possible.
7/ But: Looking at the construction and mining industry, we do not see a whole lot of improvement. Compared to 1990, the construction industry became 23% less efficient. And: The mining industry became 30% less efficient compared to 2000. Looking at the R&D expenditures does not help either. Construction companies, building materials companies, and mining companies spent 3.8%, 1.6%, and 2% respectively of their yearly revenue on R&D. Software & computer services and health care equipment & services instead spent roughly 15% of their yearly revenue on R&D.
8/ But: While innovation is currently not coming from inside the industry, we see an increase of outside investments into the space. Venture Capital funding in construction rose by ~550% from $520mn in 2015 to $3.4bn in 2018.
9/ But: Despite this strong growth, the VC funding in construction starts at a relatively low level. The total VC funding into ConsumerTech, Mobility, and PropTech from 2000 to 2019 added up to $562bn, $191bn, and $48bn, respectively. Specifically looking at the VC funding into PropTech, there seems to be an imbalance, when directly comparing it to the impact of construction.
10/ Ergo: We still have a long way to go until we achieve a decarbonized construction sector. But: from our daily discussions with ventures our daily business, we can tell that things are starting to move. Start-ups that strive to improve the industry are founded everyday, large investors are forced to ramp up their investments in start-ups tackling climate issues, and even some governments have started to implement incentives for sustainable construction.
Interested why decarbonizing construction is easier said than done? Wait for our next post.
As always, credits go to the data wizards in our Foundamental Insights Group.
Sources:
Multiple sources claim that ready-mixed concrete (RMC) is the second most used substance after water. While we did not validate this exact assessment we know that RMC is vastly used throughout the world. Yearly production rates are at ~270 mn cubic meters in the US and ~330 mn cubic meters in Europe. In India, however, concrete is predominantly mixed on site leading to a lower production volume of RMC which is at 90 mn cubic meters.
RMC is a commodity and its production not a state secret. But: the devil is in the delivery.
‘That in which our calculations fail, we call coincidence.’
— Albert Einstein
At Foundamental, we like to invest in companies that are orchestrating supply chains in the construction industry of tomorrow — in RMC dispatching there is still work to be done.
1/ The fulfillment of ready-mixed concrete (RMC) deliveries is regarded as a core competency by materials suppliers. On average, RMC producers own 90% of the RMC trucks they use.
2/ And: Profitability of RMC producers ranges between 4%-8% of their net sales. To maintain this level of profitability, companies need to maximize their RMC trucks’ utilization.
3/ But: RMC demand is not equally distributed but highly clustered around certain peak hours.

4/ Ergo: To increase asset utilization RMC producers max out their trucking capacities and overbook their delivery slots by varying degrees — if you want to know how that affects RMC truck drivers check out this blog article. Anticipating this behavior and accounting for unpredictable factors like weather and construction site progress, nifty contractors place “ghost orders” to make sure their delivery gets fulfilled at the quantity and timing they want.
5/ Ergo: Roughly 40% of the RMC orders do not get delivered as scheduled — 28% are moved to another date while 12% are cancelled. And: how are these changes being communicated? 100% in person via phone in which usually more annoyances than information are exchanged.
6/ In the past years the most common approach to improve this process’ efficiency was either to replace phone calls by new mobile applications or to use multi parameter optimizer software to optimally allocate trucks and orders.
7/ But: to our knowledge those optimizers or applications have not achieved a level of customer experience and efficiency as Amazon has for example.
8/ Why? The dependencies of RMC deliveries on weather, construction site progress, availability of workforce etc. cannot be removed in the near future. And: the way information among contractors and RMC suppliers are exchanged today (= mostly by phone) is not suitable to (1) capture and (2) share relevant data live and in a computer-processable way.
9/ Ergo: Every efficiency optimization operates under limited information quality and quantity by definition and can hence only lead to a local optimum.
10/ But: at Foundamental, we see that startups in construction tech are starting to build large datasets by closely monitoring the status and progress on construction sites. Examples are the folks at Veyor and Indus.AI. Sharing and connecting those different datasets will ultimately enable an orchestrated RMC dispatching.
As always, credits go to the data wizards in our Foundamental Insights group.
Sources:
Marc Andreessen publicly claimed that “fully loaded construction costs [for end consumers] have doubled” since the year 2000. While the research wizards in our Foundamental Insights group couldn’t corroborate the exact number Marc was referring to, we did triangulate with primary research done by the NAHB and US Census Bureau.
‘Each situation requires a new architecture’
— Jean Nouvel
Our findings: single family homes (SFHs) in the US were 88% more expensive in 2017 than in 1998. Quite close to Marc’s number. So what’s up here? Is it that houses got bigger? (they do, but only by 100–200 square feet). Is it that construction companies take a higher profit today? (mostly they don’t). Are costs for the underlying materials and components exploding? (they are not). Or is our cookie-cutter: cookie ratio maybe close to 1:1?
1/ The share of spec homes — homes that have a standard floor plan and specifications — rose to 80% in the US in 2017, up from 71% in 2010. Vice versa, custom homes had a share of only 20% in 2017.
2/ So: the proliferation of spec homes suggests an increasing standardization in the US home building industry.
3/ One way to see the impact of standardization would be in the bottom lines. But: Developer’s operating profit margins hover around 10% to 16% profit per single family home built. In real money terms: $45k to $65k. Surprised their bottom line is not higher? SFH construction companies who also act as developer and broker themselves are able to increase their bottom line per home by an additional 5–8%, bringing the total operating profit to 15–24% in most cases.
4/ Another way to check for efficiency is the speed of completion. But: Average cycle times from start to completion of new SFH increased from 9 months in the mid 1990s to 11.5 months in 2018. Again, the increasing standardization of SFH did not lead to shorter production and development times.
5/ One root cause: The construction labor crisis. Imagine Henry Ford had the T-Model blueprint and line, but had to bring in a new factory worker for every produced unit.
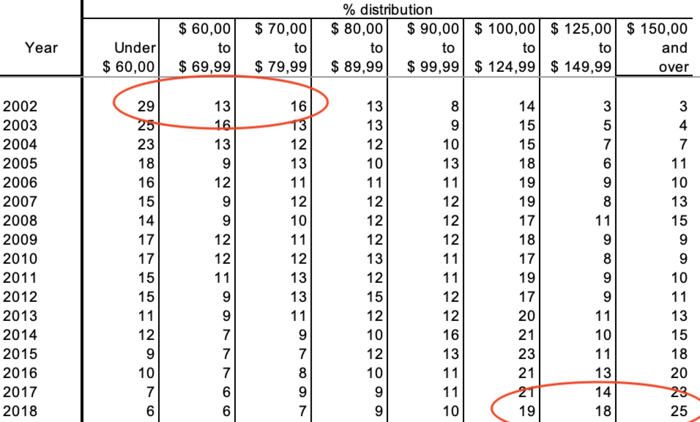
6/ But an even bigger root cause: the complexity of SFH has increased significantly. The share of homes which have production cost >$100 per sq. ft. was at 62% in 2018, up from 20% in 2002.
7/ A third key cause is: SFHs are usually built with framing and foundation, which has not been automated to date. 10% of SFH cost are for the foundation and another 17% for the framing, trusses, and sheathing. These tasks today remain highly labor intensive.
8/ And: a fourth cause is the low automation of exterior finishing. 14% of the SFH cost are used up by roofs, windows, doors and exterior walls finishing. All of these tasks remain highly labor intensive to date.
9/ But: Often times we hear that MEP (mechanical, electrical and plumbing) are a major cost driver of construction costs. While MEP installation is labor intensive, the numbers don’t support that MEP is a major efficiency lever. While 13% of SFH cost are associated with MEP incl. HVAC, less than half of those cost allocate to the installation labor. The production of the MEP material and systems already happens in factories. That brings the controllable/optimizable cost of MEP down to only an estimated 5–6% of the total SFH cost. Given the complexity of automating the installation of MEP this shouldn’t be a high priority for automation.
10/ Ergo: The numbers prove that even in cookie-cutter homes (a) the complexity of homes has continously increased and (b) even though homes are built in cookie-cutter layouts, the raw structures from foundation to exterior wall paint remain highly labor-intensive for every build and make up one third of the overall cost. To use a baking analogy: SFH home builders have cookie-cutters, but they are forced to carefully place the cookie dough in each cookie cutter, one by one.
Founder opportunities:
As always, credits go to the data wizards in our Foundamental Insights group.
Sources:
With Foundamental we are investing under a clear thesis for the construction sector: we believe in autonomous supply chains in AEC. But autonomy does not begin when ground was broken and construction has started. In fact, we realized that to unlock full autonomy for our sector, we need to build autonomous pre-construction processes as well.
‘Never tell me ‘the sky is the limit’ when the zoning code imposes stricter limit.’
— Paul Brandt
It all starts with project developers, and how they source land and interpret local form-based code. We dug deep into this theme for the past several months, talked to the leading tech players in this space, and got excited by a handful of founders. We came to realize: the process of sourcing land and interpreting code is broken, big time. Those who fix the pre-construction will be in the position to integrate further into the construction phase, and help build supply chain autonomy there.
1/ Developers and architects are bound by form-based code, consisting mainly of building code and zoning code in all major economies and municipalities around the world.
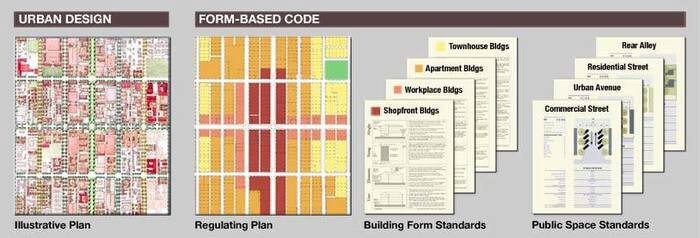
2/ But: building code and zoning code is (A) highly specific to the city or even municipality, i.e. non-harmonized across regions or countries, and (B) documented in convoluted, unstructured and non-harmonized formats, eg. law texts in long-sentence formats as PDF or HTML.
3/ That means: building and zoning codes do not come in machine-interpretable form, nor are they written in standardized form across municipalities. Each municipality writes in their own way.
4/ Result today: when a developer identified parcels they would like to develop and build on — say for a new shopping center — they have to manually look up and interpret the local codes. Today’s process is:
Land identified >> code looked up >> architectural concept drawn >> compared to code again >> business case drawn >> offers made >> reply received >> back to architectural drawing board to make adjustments >> compared to code again >> etc etc …
The lack of automated code interpretation leads to a process with multiple iterations.
5/ Now comes the double-whammy: in many cases developers might own or have an option on one parcel, but actually need multiple adjacent parcels in order to develop their project (eg. said shopping center). This complication adds further dependencies across the above iterative process, as the architectural concept and the business case depend on the size of the project, and the parcels available to the developer. Practically: the developer needs to find the data on all parcels, identify the owners, calculate how much can be offered in order to make financial sense, and make the actual offers to the owners.
6/ Metrics in manual process: Our deal flow and research shows that it takes one employee in a good real estate development firm on average 7 manual work days to find data on one parcel and interpret the codes for that one parcel they are interested in. And: that same employee can successfully source on average 50 parcels for projects per year (i.e. what comes out at end of the funnel)
7/ Metrics in automated process: With tech companies that integrate and automate the identification of parcels and interpretation of local codes:
8/ Ergo: those productivity and speed increases are of immediate value. But: imagine what happens to the traditional manual method as code requirements for developers and architects increase further, especially driven by the carbon footprint of their projects.
9/ And: tech companies owning the automated sourcing of land and interpretation of code own the first project touchpoint. They form the earliest entry point to developers, architects, GCs and their newest projects.
10/ Ergo: we invest towards fully autonomous pre-construction. Imagine an AEC process in which the above tech companies automating building/zoning codes partner and integrate with auto-generated building designs (eg. Hypar), multi-parameter optimized project schedules (Alice) and integrated and transparent project financing/risks assessment (Rabbet, Reonomy, Credifi).
As always, credits go to the data wizards in our Foundamental Insights group.
Sources:
In almost all discussions we had at Foundamental in 2019 with corporate partners and our newest LPs, the topic of robotics and automation in construction came up this year. Not a surprise, since the message that the construction sector is lagging behind in productivity has sunk in fairly well.
‘It is comparatively easy to make computers exhibit adult level performance on intelligence test or playing checkers, and difficult or impossible to give them the [adaptive] skills of a one-year-old when it comes to perception and mobility.’
— The Hans Moravec paradox, in his Stanford PhD thesis on ‘Obstacle Avoidance and Navigation in the Real World by a Seeing Robot Rover’, 1980
When we recently dug into our deal flow of the past 18 months specifically looking for patterns of what tasks tech companies in construction automate first, we couldn’t help but observe one thing: there doesn’t seem to be a clear pattern. Some go after highly labor intensive tasks, some go after highly repetitive tasks, some go after a set of tasks with a high share of total project cost. Our conclusion from both sides (corporates and tech companies) was: there is a lack of understanding what tasks are best suited for automation in construction. We needed a better framework.
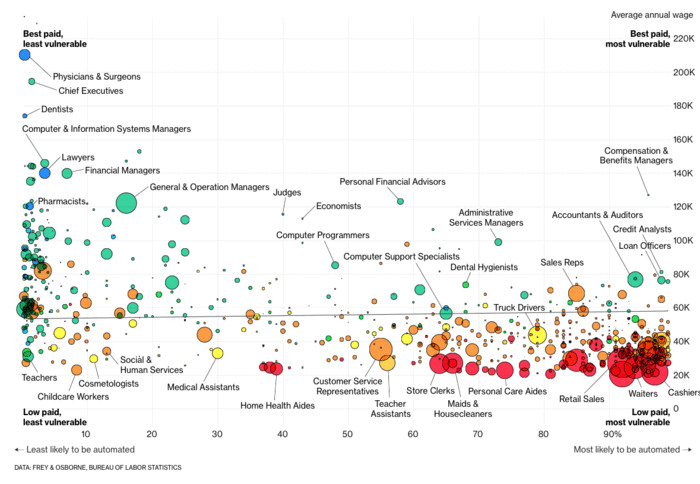
1/ Automation of tasks has been a widespread public topic for the past 5 years. The general simplistic analytical framework widely used by many analysts has been that repetitive tasks have a higher probability of automation while problem-solving or creative tasks have a lower probability. Examples of such a simplistic analysis can be found across public media:
2/ And: we can observe the automation of physical tasks in many industries. In 2018, the global operational stock of industrial robots was at its peak (2’440’000 installed industrial robots). The largest industries represented in this data set are automotive, electronics, metal and machinery, plastic and chemical products, and food. In South Korea 2’435 multipurpose industrial robots in the automotive sector are installed per 10 000 employees. (In Canada: 1’354, US: 1’200, Germany 1’162, Japan 1’158). This data confirms that automation of physical tasks is not just a mirage, but it has happened in several industries.
3/ And: in construction technology, automation of physical tasks is a hot issue for GCs. Shortage of skilled labor is a significant problem in practically all mature economies. Health & safety concerns are top of the agenda — in 2018, the US construction industry accounted for 1,003 fatal injuries at 12.2 fatalities per 100’000 construction workers. In 2018, construction worker was unfortunately the deadliest job in the US private industry (bear in mind: US = mature economy).
4/ But: we don’t see anywhere the same degree of task automation in the construction sector as we see in other industrial sectors. Proof: Agriculture and manufacturing gained 240+% of labor productivity since 1990. Construction: dropped by -23% in labor productivity. So what might be the reasons, although the opportunity is in plain sight for everybody ?
5/ We found: applying the above simplistic framework of “task repetitiveness” alone does not accurately represent the automation of tasks in construction. By that logic, hammering nails into walls should have been automated first. Instead…
6/ We see that a second key automation criterion is the control over dimensions. By that we mean
(a) how many components/parts of the exact same dimensions do you repeat a task on and
(b) how repeatable and unobstructed are the surrounding dimensions around the part/component.
7/ Example: In automotive, punching sheet metal parts for a car is a repetitive task in itself. But: also (a) the dimensions of the part itself are repeatable as is (b) the surrounding environment of the tool/die you punch on. Meaning: the environment is standardized as well. This unlocks a high degree automatability of this specific task without requiring adaptive skills.
8/ In construction, most tasks you will find will be applied to parts/components or surroundings with a high variability of dimensions and low control of dimensions. “Every project is a prototype” is a famous saying in construction. All the more surprised are we about how many companies are first going after the automation of tasks with highly variable dimensions in construction. This is the most difficult automation to achieve. The problem with this approach is that you have to engineer robotics that are able to gain control over the environment, which is exponentially harder than to automate for tasks where you already control the dimensions and environment.
9/ Ergo: it appears more fruitful in construction not to blindly follow a principle of “we fully automate the highest cost tasks” (which, honestly, the majority of robotics players we see in our deal flow seem to be following) but instead follow a principle of “we partially automate moderately labor-intensive repetitive tasks with highly repetitive dimensions”. This principle leads to augmentation of labor rather than replacement of labor, and reduces the skills needed by workers. This can also help solve the skilled labor shortage. A good example of this approach is our portfolio company Mighty Buildings.
10/ Applying the above framework, we see several Founder Opportunities in the space of automating construction tasks we would like to fund more:
As always, credits go to the data wizards in our Foundamental Insights group.
Sources:
Up until very recently, ConstructionTech has remained a new and surging space in the eyes of many horizontal VCs. At Foundamental we are recently having more of our friends at top tier horizontal VCs reach out to us as those firms begin to formulate in-house theses on our sector. They see the same rising tide that we see:
‘The best time to plant a tree was twenty years ago. The second best time is now.’
— Chinese saying
Now: One of the earliest and most publicly covered technologies in our space is 3D construction printing (3DP). As such, it is the topic that horizontal VCs new to our space tend to ask us first about. Within Foundamental we identified 154 players in the 3DP space, and we looked deeper at ca. 30 of those companies across North America, Europe and Asia-Pacific in the last 12 months. We were intrigued by a handful of those during live deals, and so far ended up investing alongside our friends at Khosla into our favorite full-stack 3DP housing leaders at Mighty Buildings. Our diligences produced a number of initial learnings on 3DP.
1/ By material, 85% of companies applying 3DP in construction are applying concrete, while 15% make use of other materials such as polymer-based material.
2/ By location, 70% of 3DP construction players focus on on-site printing, while 30% print off-site.
3/ By application, 50% focus their technology on printing entire houses. The go-to floor size is still below 70 sq.m. (ca. 700 sq.ft.) in most cases, but scale is picking up and some of the more advanced players are in the process of reaching 300+ sq.m. (3000+ sq.ft.). The other 50% commit to not print houses but instead print components such as walls, columns, floors, or stairs.
4/: By degrees of freedom, half of the 3DP players apply a gantry system. These are 1:1 the same players that focus on printing entire houses (see above) due to a railed gantry’s ability to create one batch as a terminal production line. The vast majority of those is printing on-site and with concrete (eg. the vastly talented crew over at ICON), with a few notable outliers in this category (eg. Mighty Buildings who produce off-site with substitute materials). The other half relies on a non-gantry system, most commonly six degrees of freedom robotic arms and — more rarely — circular robotic arms (eg. Apis Cor).
5/ Finally, by mode of discharging the material, 95% of players rely on extruder heads calibrated to their material mix and environmental/atmospherical conditions. The remaining 5% are using alternative modes such as discharging with pressurized air.
6/ But: there are product challenges that occur more commonly with extrusion-based concrete printing technology:
7/ And: in terms of value, we believe there are fundamentally 3 value levers that 3DP players address:
8/ Now, all of the above is well known for industry insiders. Which is why there is a pattern that emerges and that strikes us: you can separate the 3DP space in construction — today, in November 2019 — into two oceans. On the one side, there are highly-talented companies who found a segment and value model they want to serve, and built a to-purpose technology that fits their model. On the other side, you can see companies with strong tech talent who started their journey based on a technology they master and who seem to be still looking for a fitting segment and value model to apply it to. In our assessment, the latter contains 90+% of the players in the 3DP market, while the former are the ones that scale more rapidly in construction.
9/ We have developed our own framework of which 3DP technologies — defined by the above parameters — and which construction applications we believe are likely to have a good product-segment fit based on intrinsic value. For example: A pressurized air “shotcrete” solution that can be shot around rebar using two 6-axis robotic arms with modularized deployment and lightweight logistics is ideal for an on-site printing of structural parts for bridges and tunnels. This solution will never be ideal for printing tiny homes, but it has an intense product-segment fit. On the other hand, solutions that focus on single family homes we look at through the lens of Clay Christensen’s disruption theory. Here we like solutions that begin in underserved home segments and hone their production, logistics, customer experience and revenue model and work their way up to the volume home segments from there.
10/ When we get to see a new 3DP deal we look immediately for fit and intrinsic value of the combination of technology, segment and revenue model. With that we identified a few Founder Opportunities we would like to fund more:
As always, credits go to the data wizards in our Foundamental Insights group.
Sources: